

We recently touched upon the Core Web Vitals in our previous article . These metrics are being introduced in June - August of 2021 and will be a ranking factor on where a website will appear on a Google search results. They are otherwise known as Tier 1 Performance Metrics and play a very important role in a website’s performance and user experience.
What you may not know is that there are another set of metrics called Tier 2 Performance Metrics. They are not as well known but play a highly significant role in providing a lot of insight that can help identify website performance bottlenecks. These metrics have been used for a long time and include Time to First Byte, First Contentful Paint, Time to Interactive and also Speed Index.
There are currently 5 areas which factor into a website’s overall Lighthouse Score. These include Performance, Progressive Web App, Best Practices, Accessibility and SEO. With the exception of Time to First Byte, these Tier 2 Metrics along with the Tier 1 Metrics all contribute towards calculating a website’s Performance Score.
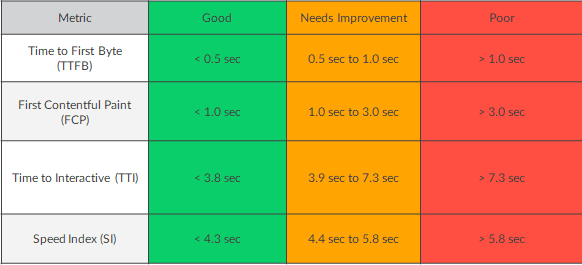
The table below demonstrates the Good, Moderate and Poor score ranges for each of these Tier 2 Performance Metrics.
Time to First Byte:
TTFB is a metric which measures the time between a user making a HTTP request and the first byte of page content being received by the user’s browser.
When a user navigates to a URL on their web browser, the browser will then make a network request to go and fetch that content. The request is then received by your server in order to return the page content.
The server may be required to do a lot of work to return a page with all of the requested content. One way to reduce the time that user’s spend waiting for their content to load is to optimize the server to work as quickly as possible.
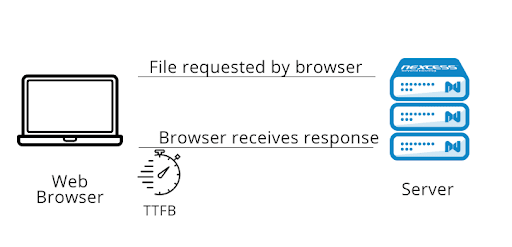
(Image from https://blog.nexcess.net )
Suggestions on how Time to First Byte can be improved are -
- Optimize the server’s application logic to prepare pages faster.
- Optimize how your server queries databases, or migrate to faster database systems
- Upgrade your server hardware to have more memory or CPU.
First Contentful Paint:
FCP is a metric which measures the time from when the page starts loading to when any part of the page’s content is rendered on the screen. The content for this metric can be anything from images, background images, text, elements and non-white elements.
This is an important user-centric metric that is used for measuring perceived loading speed as it marks the first point in the page load timeline. A fast FCP speed helps to give visual feedback to the user and assure them that their request is currently in progress. This will be the first metric which demonstrates user experience.
There are several way to implement a faster First Contentful Paint speed -
- Remove or minimize any unused CSS
- Eliminate render-blocking resources
- Reduce Avoid multiple page redirects
- Reduce your server response times (TTFB)
- Ensure that text remains visible during webfont load
- Keep request counts low and transfer sizes small
- Minimize critical request depth
Time to Interactive:
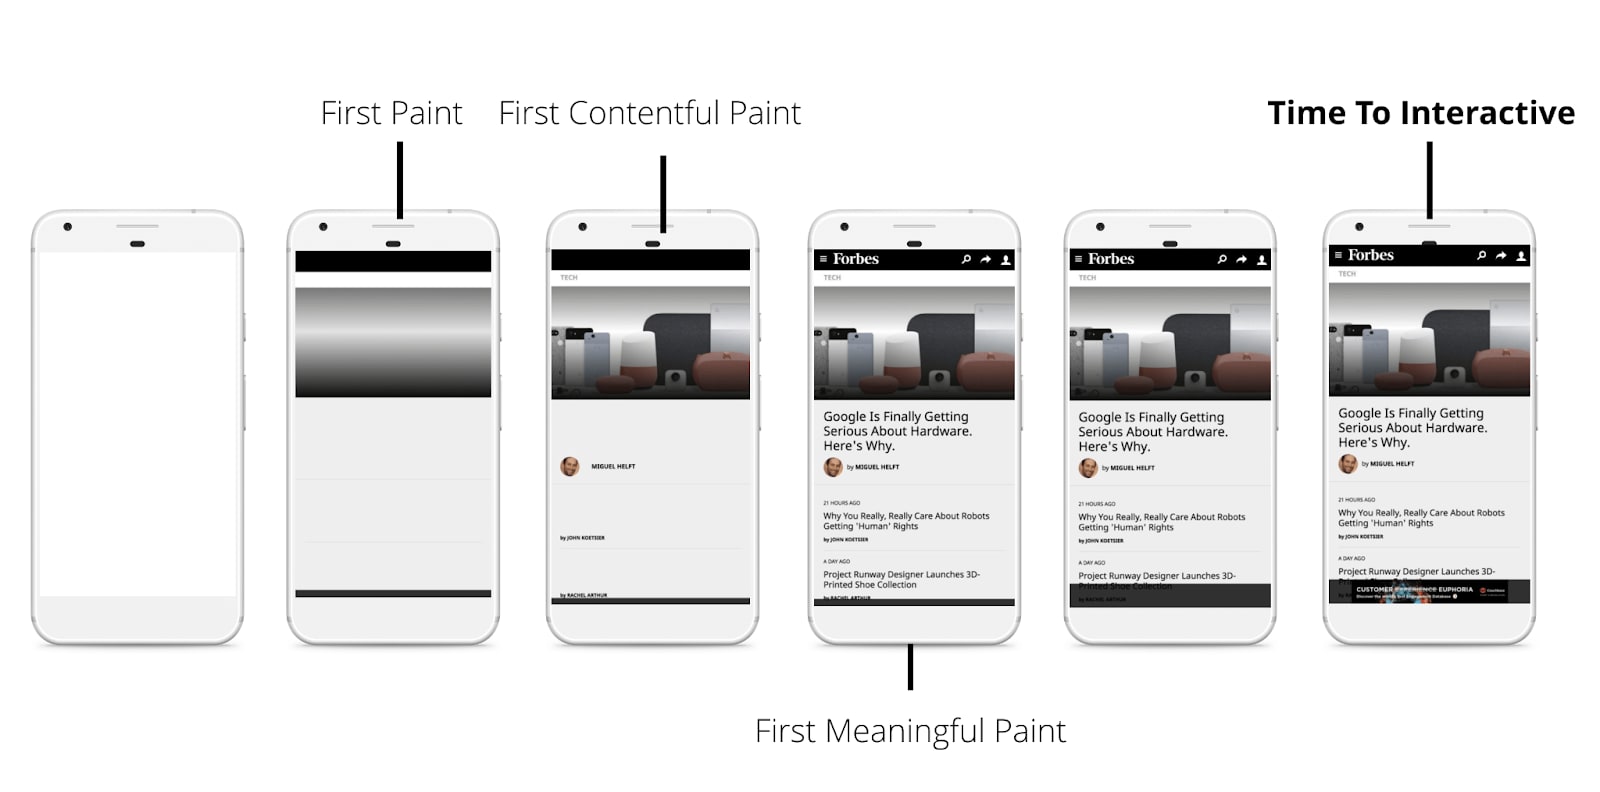
TTI is an important metric which measures load responsiveness which helps to identify when a page looks to be interactive. This is the time from when the page starts loading to when its main sub-resources have loaded and it is capable of reliably responding to user input quickly.
This metric has a high impact on a user’s experience. When the page looks like it is ready to use, and the user clicks a button or tries to scroll, then it can cause a lot of frustration when nothing happens. This could potentially lead to a high level of users abandoning the website.
(Image from https://www.splunk.com )
You can look into reducing delays in your Time to Interactive speed by -
- Minimizing JavaScript
- Preconnect to required origins
- Preload key requests
- Reduce the impact of third-party code
- Minimize critical request depth
- Reduce JavaScript execution time
- Minimize main thread work
- Keep request counts low and transfer sizes small
Speed Index:
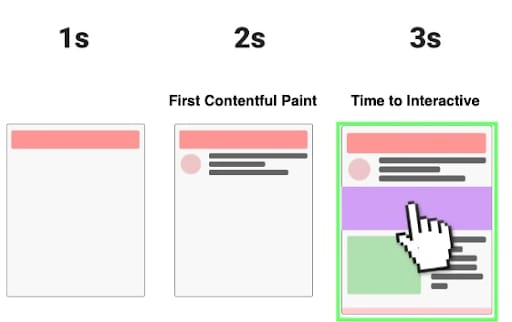
SI is a measurement of how quickly the page of above the fold content is visually displayed, at the end of the loading process. It is complementary to Largest Contentful Paint (one of the Core Web Vitals), which measures when the largest single element has been rendered on the page.
The Speed Index is a calculation of the percentage of the page that is visually complete at every 100ms interval, until the page is fully displayed. If a website has a good SI score, it is a very good indication that it’s performance is healthy.
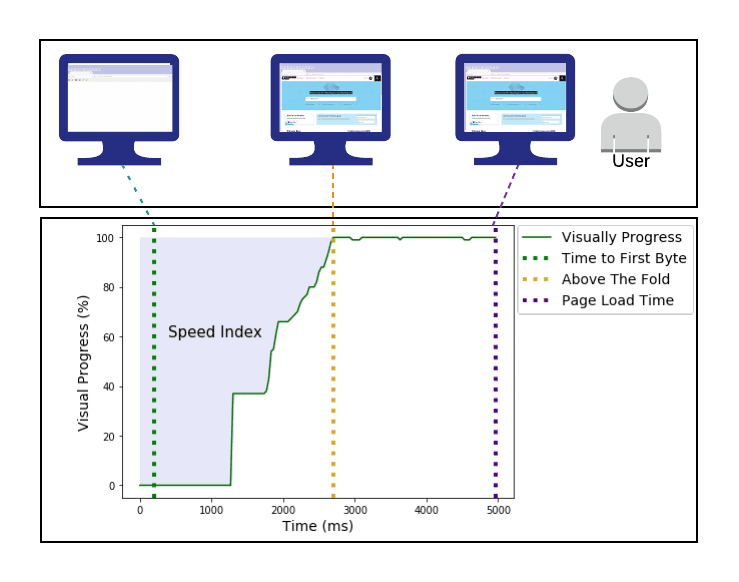
(Image from https://developer.mozilla.org/ )
You can improve the Speed Index -
- Minimize main thread work
- Reduce JavaScript execution time
- Ensure text remains visible during webfont load
We hope you have enjoyed reading this article. If you would like expert advice on how Optimal can help you achieve a faster performing website, in line with these important Performance Metrics, email us at insights@thisisoptimal.com


