

Introduction
User scripts were first available with Greasemonkey, originally as an extension for Firefox. They have never really become mainstream but they can fill a very useful role in quickly prototyping enhancements and fixing annoyances in many websites. There are some great examples that people have shared on sites such as Greasy Fork .
Some of our customers at Optimal use Splunk Synthetic Monitoring for monitoring their websites (they were previously known as Rigor until their recent acquisition). Similar in approach to webpagetest.org , Splunk Synthetics provides a vast amount of data to help us with ongoing performance monitoring. One of the most useful features is it’s custom report capability, which allows you to compare performance data for different sites and time periods.
Splunk Synthetics custom reports show a lot of detail but the table view can make it hard to identify outliers and concerning data points. Here is an example report.
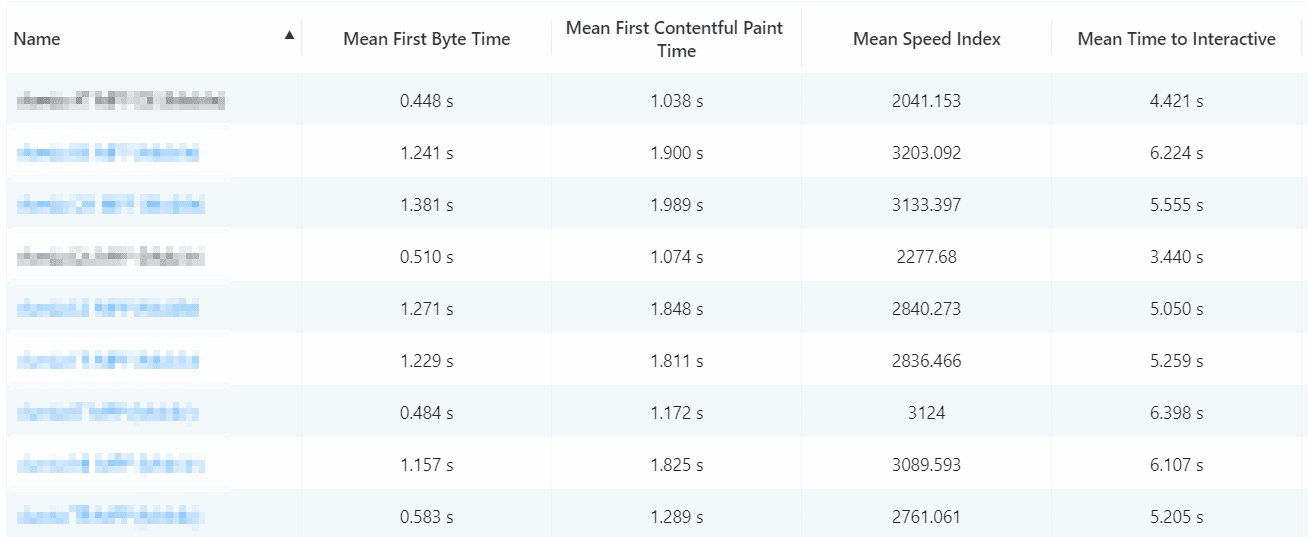
For one of our clients, preparations for Black Friday 2020 required continuous monitoring for more than 500 ecommerce websites.
Our key goal was to identify any sites that were responding slowly under the expected heavy load during Cyber Week, and for any performance problems that might prevent customers from completing their purchases. We created Splunk Synthetics custom reports to monitor all 500+ ecommerce sites, and proactively monitored these throughout Cyber Week to spot any problems (we did this in addition to monitoring RUM data and running load models prior to the event).
Automated monitors are essential, but we still needed visibility into the status of the sites as the day unfolded.
How can we make this report more useful?
The obvious problem with the screenshot above is that it contains all the critical information but it displays as a big table of numbers, which does not highlight any problems or outliers. With 500 sites to watch, that becomes a very big wall of numbers. What we really needed was a way to color code the data so that problems would be obvious at a glance:

Splunk Synthetics does not provide this functionality. So … time to put a bit of extra JavaScript into the page.
JavaScript to the rescue
Before investing too much time into implementing a tool, I like to be confident that the solution I am planning is going to work correctly. The first quick step is to prove that the script we want to build is achievable with a reasonable amount of effort. Like many developers, I have been tempted to spend 4 hours building a tool to avoid an hour of manual work, and I try to restrain that impulse.
So we start in the browser devtools. Initially I am checking that the HTML code is constructed in a predictable way, so that the script will be able to find the elements we want to affect:

This shows that the data is laid out very much like a traditional table structure, although it is using div elements rather than an HTML table tag.
As it happens this page also has jQuery installed, and I will use jQuery syntax as a shortcut in my script, but of course you might not need jQuery . In the browser devtools, we can test out navigating to a specific data cell and adding a CSS effect:
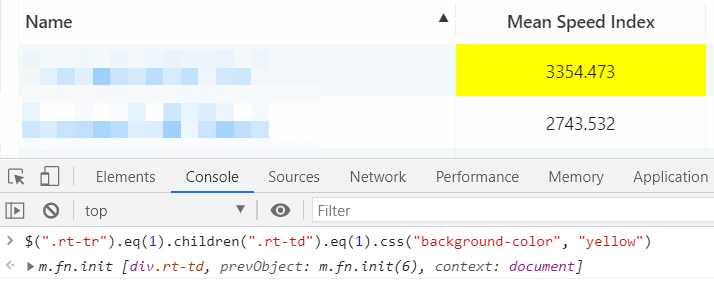 Armed with this information, we are confident to start building.
Anatomy of a simple user script
There are a number of successors to the original Greasemonkey user script tool. I have been using ViolentMonkey , which works well (although the name bothers me).
To start, install this extension in your browser, and then click on the option to create a new user script. If you want to use my script, the code is available on my Github repo .
If it’s working you should see a colorful button appear under the top right navigation when you refresh the page.

All scripts have to start with a boilerplate comment, which includes metadata about the script:
// ==UserScript==
// @name        Custom Report tweaks for rigor.com
// @namespace   https://github.com/fiann/greasemonkey-scripts/
// @match       https://monitoring.rigor.com/reports/*
// @grant       none
// @version     1.0
// @run-at      document-idle
// @author      Fiann O'Hagan <fiann@thisisoptimal.com>
// ==/UserScript==
The first important declaration here is the @grant none attribute. This states that the script does not require any of the potentially dangerous Greasemonkey API
calls. Greasemonkey creates a security wrapper
around the window object and other global variables, but we can ignore it for this project.
The second declaration is the @match attribute which specifies the URLs where the script will be injected. In this case, we have the URL root for all Rigor reports, with a wildcard for the report ID.
The button in the screenshot is created with some simple jQuery code:
const button = $(`<button class="budget-button">Use budget colors</button>`);
button.click(setBudgetColors);
$(".reportHeader .row:first").append(button);
The rest of the script simply loops through the cells in the heading row and captures the text of each heading in an array:
let headers = [];
header_cells.each((h_idx, h_elem) => {
  headers[h_idx] = $(h_elem).text().trim();
});
As we loop through the data in the table, we will know that the header of the first column is “Mean Speed Index” and we can use this as a lookup to a simple data object:
const budgets = {
  "Mean First Byte Time" : { green: 0.5, red: 1.0 },
  "Mean Speed Index" : { green: 4300, red: 5800 },
  // ... more values ...
};
After that, it’s just a matter of checking the value in each cell. If the value for the Mean Speed Index is lower than 4300, then it’s green. If it’s above 5800, it will be red. In between is yellow.
Conclusion
This is an example of a project that could easily grow to become a Chrome or Firefox browser extension. There are several enhancements that would make good next steps, for example providing some kind of user interface to edit the red / green thresholds rather than hard coding the values in the code, and creating some way to synchronize the thresholds between different people in the team. The extra overhead of creating and supporting a full browser extension (even assuming that it is a worthwhile exercise) can seem prohibitive and stop the project before it gets started.
GreaseMonkey and user scripts fill the gap between “nothing at all” and even the most minimal of Minimal Viable Products. They are a great way to make a quick (and dirty) update to websites to help scratch an itch. Don’t be afraid to make enhancements to third party products, for your personal or team internal use (and also share them with the vendor so that they can make improvements to their products).
What will you create?


